
| Computers Meet Weather Forecasting |
||
In 1943 preliminary work was started on the first automatic computer with no moving parts, called the ENIAC (Electronic Numerical Integrator and Computer). Interestingly, attitudes in the military department overseeing the project were “at best unenthusiastic and at worst hostile.”[24] A team of scientists, engineers, and mathematicians working together finished the computer in 1945, 6 weeks after the war ended. It fit inside an air-conditioned 50’ x 30’ room and could perform about 5,000 operations per second (figure 3).[25] With the war over and the project declassified, news of the ENIAC and its successor, the EDVAC, quickly reached the media and the scientific community.[26]
Up to that point, advances in meteorological theory after Richardson’s work had only been developed for practical weather map forecasting techniques. Trying to apply them to numerical approaches would be a huge challenge, and it was uncertain whether or not it would actually work.[28] Fortunately, the legendary mathematician John von Neumann, who played a major role in developing the ENIAC, wanted to “demonstrate the social and scientific potential of such a device by putting it to work on the weather.”[29] (His motivation stemmed from his belief that if we knew how to predict the weather we might learn how to control it – and potentially use it as a powerful weapon.) Work towards this goal was slow because the computer was not powerful enough to handle all of the necessary equations, and attempts to remove equations from the model produced unrealistic weather forecasts. A critical step forward was made in 1947, when Jules Charney discovered the “quasi-geostrophic approximation”. This was essentially a single equation that substituted for six of the existing ones while minimally impacting their forecasting ability.[30] Charney’s simplification made the model simple enough to plausibly run on computers imaginable at the time. In 1950, the first realistic 24-hour forecast was successfully calculated on the ENIAC in about 24 hours.[31] But with refinements of the model and the construction of new, faster computers, the forecasting time was reduced to an amount plausible for “operational” weather forecasting (issuing forecasts on a regular basis to be used by government, corporations, and individuals). The first numerical operational weather prediction service began in 1955 using an IBM 701 computer[32] that could perform about 10,000 operations per second (figure 4).[33] However, the forecasts it produced were not as good as those made using traditional weather map methods until the computer was replaced in 1958 by an IBM 704 running almost ten times faster.[34]
Due to rapid improvements in computer speed and expansion of observational capacity (including the deployment of the first weather satellites)[36], meteorologists in the 1950’s and 60’s were extremely optimistic about the future of numerical weather prediction. The general consensus was that this progress would continue unabated, with remarkable outcomes. As late as 1970, Stanford scientists began a compilation on Global Weather Prediction with the proclamation that “within five to ten years it should be possible to make accurate 10- to 14-day weather forecasts.”[37] The main “obstacles” they acknowledged were “to set up a global data-collection system and to perfect our physical understanding of the atmosphere,”[38] issues they believed could be remedied with a “World Weather Watch” and “Global Atmospheric Research Program.”[39] Scientists were correct only in their prediction that the raw power of computers would continue to expand. “Moore’s law”, which posits that computer speed and data-holding capacity double every 18 months, has held true almost uncannily for at least 30 years (figure 5). The computer used today by the National Oceanic and Atmospheric Administration (NOAA)[40] is approximately a hundred million times faster than the IBM 701 first used for operational forecasting in 1955. Modern personal computers can now easily perform the calculations made for what was then cutting-edge, supercomputer weather prediction as recently as 1990.[41] In fact, in a single minute a modern personal computer can re-execute every calculation made over the first 5 years of operational weather forecasting.[42]
Figure 5: Logarithmic graph of the speed (in thousands of operations per second) of the computers used for operational forecasting at the U.S. National Center for Environmental Prediction (NCEP) over the years. Every jump between horizontal lines is a factor of ten speedup.[43] Yet despite this exponential increase in computational power, the accuracy of forecasts has increased in a decidedly linear fashion. Nothing shows this better than the graph of “anomaly correlations” for forecasts made by the European Centre for Medium-Range Weather Forecasts (ECMWF) (figure 6). Anomaly correlation is an indicator of forecast accuracy based on comparison of predictions and actual weather; anything above about 60% is considered “useful.”[44] The vertical axis measures how many days ahead are being forecast, and the colored lines represent constant anomaly correlation over the past 20 years. Thus, in 1980, predictions beyond about 5 days were essentially useless; but by 1998 5-day forecasts were fairly accurate (80% anomaly correlation). Looked at in a slightly different way, we can now predict 5 days ahead with the same accuracy as we could predict only 3.5 days ahead in 1980. (The lines shown are actually averaged out over a running 5 year period to smooth out yearly changes in the natural predictability of the weather.)
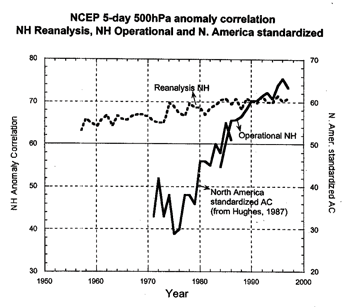
Figure 6: Increase in weather prediction accuracy since 1980.[45] In retrospect, meteorologists vastly underestimated the computational power necessary (“100 times faster than those currently available”[46]), the scale of research necessary (“100 million dollars over a five-year period”[47]), and the ease of attaining global cooperation. Why did their optimistic outlooks prove to be so stubbornly unattainable? If they had been keeping up with the obscure scientific literature, they might have noticed a possible answer years before their book was released. In 1963, Edward Lorenz published his first paper on the discovery that the atmosphere (and many other phenomena) are what is now known as “chaotic” systems. This means that even though the physical equations describing changes in pressure, humidity, etc. are “deterministic” (if you solve them many times using the exact same starting values, they will always yield the same answer), they exhibit extremely “sensitive dependence on initial conditions”.[48] In other words, small changes in initial conditions will ultimately affect the whole system in significant but unpredictable ways. This is the origin of the now-famous anecdote that the flap of a butterfly’s wings in Indonesia could cause a hurricane in the U.S. Mathematically, this happens because the nonlinear differential equations involve feedback, which reinforces errors (no matter how small) at each time step.[49] Most scientists thought that small changes in certain critical spots would affect the weather on a large scale, but they did not realize that small changes anywhere would end up having such large effects.[50] This makes extensions of the forecast further into the future more and more difficult, because the longer you go, the more errors grow. Lorenz went on to calculate that “even with perfect models and perfect observations, the chaotic nature of the atmosphere would impose a finite limit of about two weeks to the predictability of the weather.”[51] However, while this is surely an important result, it doesn’t seem to be the factor currently holding up progress. For one thing, even today we can only make useful forecasts of up to about 7 days – half the chaotic limit. Moreover, the lines of improving accuracy in figure 6 do not seem to be leveling off as they would if we were truly approaching a limit. The possibility that forecasting accuracy is limited by the available observational data is also implausible. Judging from the recent availability of detailed radar and satellite images on TV and the Internet, it appears that our observational ability has increased in an exponential (rather than incremental) manner. Furthermore, recent “reanalysis” projects have shown that increases in observational data have played a fairly minimal role in improving forecasts (figure 7). Comparing this graph with figure 6 above reveals that since 1980, better observations have only accounted for perhaps 3 of the 15% jump in accuracy. Other studies have shown that clever use of existing data streams has been much more important than improvements in observing systems themselves.[52]
Figure 7: The impact of observational data in forecast accuracy. The solid line is the historical forecast accuracy; the dotted line is the forecast accuracy using the 1991 model with observational data throughout the period shown.[53] The real answer seems to lie in the exponential computational difficulty of increasing the “resolution” of atmospheric models. (Resolution is the number of grid points and time steps that are kept track of in any given model.) The principle that small changes anywhere can be important means that improving a model requires increasing the resolution in all 4 dimensions – 3 in space and 1 in time – thereby increasing the total number of calculations by 2^4.[54] On top of that, working at a new, finer level of detail means that smaller-scale atmospheric processes might become important.[55] Taking those into account requires both scientific understanding and still more computations. Thus according to Moore’s law, increasing the resolution of a model by a factor of two would take 4 doublings in computer power, i.e. 6 years. Indeed, we find that the NCEP model introduced in 1978 used 7 layers; in 1985 it used 18 layers; in the late 80’s several new physical equations were introduced; and in 1993 28 layers were implemented.[56] In short, computing power is the limiting factor when it comes to extending the range and accuracy of weather forecasts. Therefore, the future of computers will largely determine the future of forecasting.
Footnotes
|
||